Scope 3 Ecosystem - User Experience
Turning a fragmented emissions platform into a connected, trustworthy experience
11/15/20251 min read

Overview
Scope 3 is complicated — hundreds of suppliers, inconsistent data, missing values, outdated reports, and no single place where everything comes together. When I joined the Sus-Intel team, the platform could calculate emissions, but there was no clear way for users to understand where the data came from, what was real, what was estimated, and what to do next.
From a UX perspective, this was a classic systems-design challenge: the pieces existed, but the mental model didn’t. My work focused on creating a connected ecosystem, where corporates and suppliers could finally trust the numbers in front of them — and understand how everything fits together.
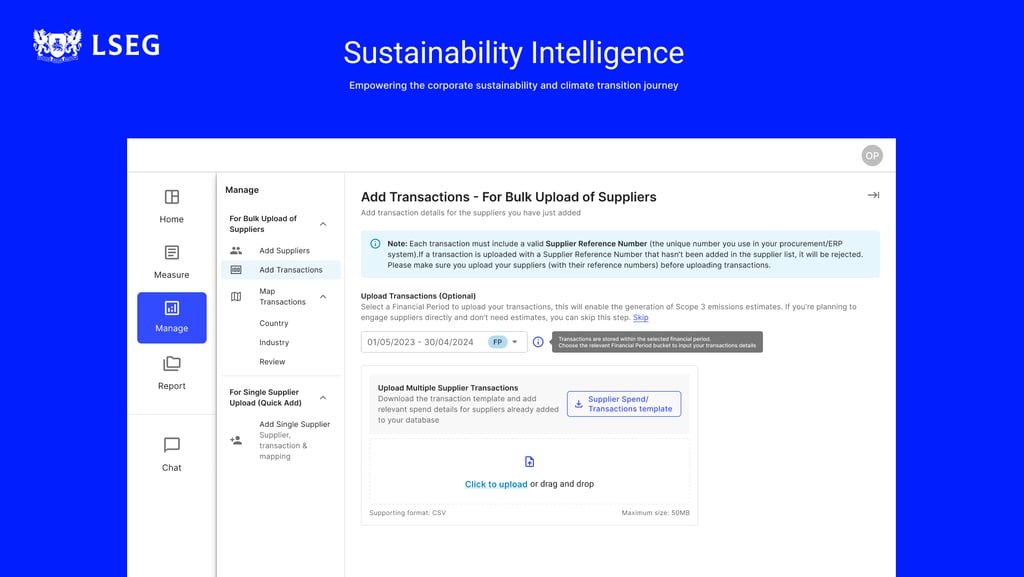
Users had to recalculate Scope 3 from scratch every time, re-uploading their entire supplier list with no way to store or time-stamp data — making the estimates effectively unusable.
Biggest pain point in the entire Sus-Intel offering:
corporates couldn’t trace where emissions data came from
suppliers kept getting repeated surveys
estimates and reported values were indistinguishable
nothing connected across engagements, reporting periods, or analytics
users had zero mental model for how Scope 3 worked
and suppliers had no continuity or visibility into how their data was used
In short: The platform could calculate emissions, but nobody could make sense of them.
And that was the mandate given to me —
redesign the entire Scope 3 ecosystem so it finally made sense to humans.
This wasn’t a “revamp a page” brief.
It was a core redesign of the platform’s most complex workflow, spanning:
information architecture
systems UX
data transparency
supplier journeys
emissions logic
roles, access, context, and engagement
analytics interpretation
and future scalability