Climate MAP — Turning Complex Climate Data Into Clear, Actionable Insights
A clear view of climate ambition, management, and performance - all in one place
SCOPE 3CLIMATEMEASUREPERFORMANCE
Product strategy | UX Lead
11/15/20251 min read

Overview
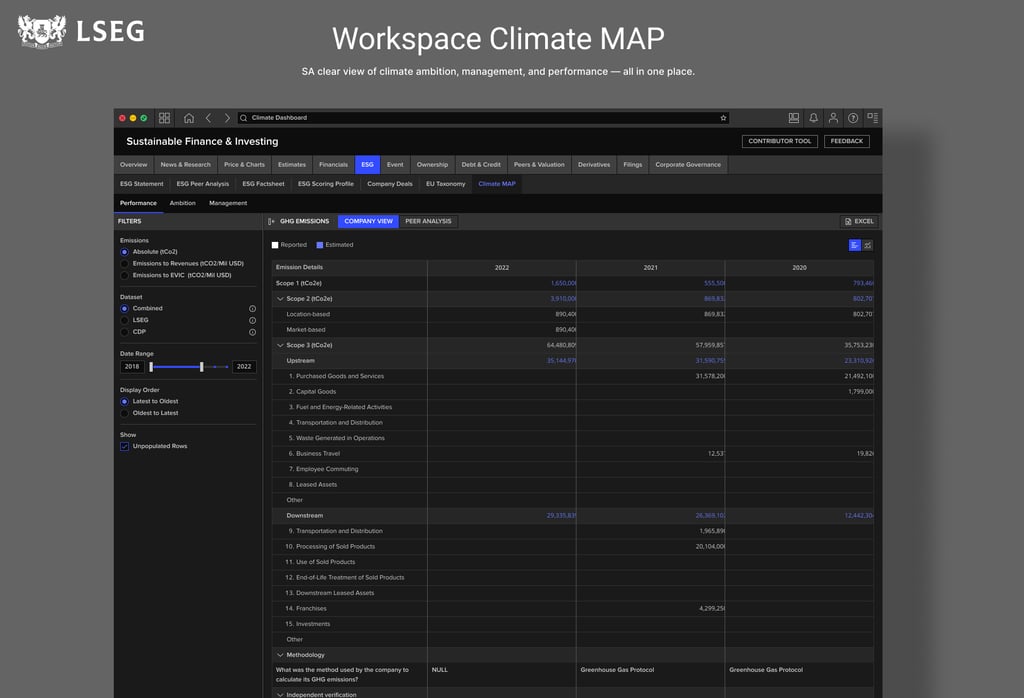
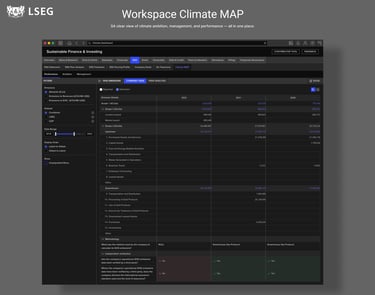
Climate MAP is LSEG’s Workspace application that helps investors, corporates, and banks quickly understand a company’s Climate Management, Ambition, and Performance. I partnered with senior climate researchers to define the MAP framework and led the product and UX strategy for the first release — turning complex, scattered climate disclosures into a clear, structured view users can trust.
The Problem
Climate data is huge, inconsistent, and difficult to interpret. Users struggle to understand:
Whether a company has credible net-zero plans
How strong its governance is
How its emissions are trending
What’s reported vs modelled
How to compare companies reliably
The result: climate risk analysis is slow, confusing, and hard to defend.
My Role
Co-defined the 3-pillar MAP framework (Management, Ambition, Performance)
Led the UX, IA, and product strategy for the Workspace integration
Designed a structured narrative that blends reported and modelled data transparently
Built the comparison and deep-dive experience across hundreds of metrics
Partnered with engineering, climate researchers, and data science teams
Solution
I designed Climate MAP as a structured, transparent evaluation model that helps users quickly understand climate credibility.
Key elements:
Three clear pillars that simplify complex climate signals (Climate Management, Ambition, and Performance)
Transparent indicators showing what’s reported vs modelled
Forward-looking insights aligned with global frameworks
A clean comparison model for peers and sector pathways
A guided IA that moves from high-level confidence signals to detailed evidence
The experience is simple, but the underlying data is deep — from targets and transition plans to emissions trajectories and sector benchmarks.
Impact
Delivered the first Climate MAP application within LSEG Workspace
Helped users make confident climate decisions with a unified model
Strengthened trust by clearly separating reported vs modelled data
Adoption grew ~176% between July and October 2024 (peaking at 526 monthly users)
Created the foundation for future climate analytics, benchmarking, and ITR-driven insights