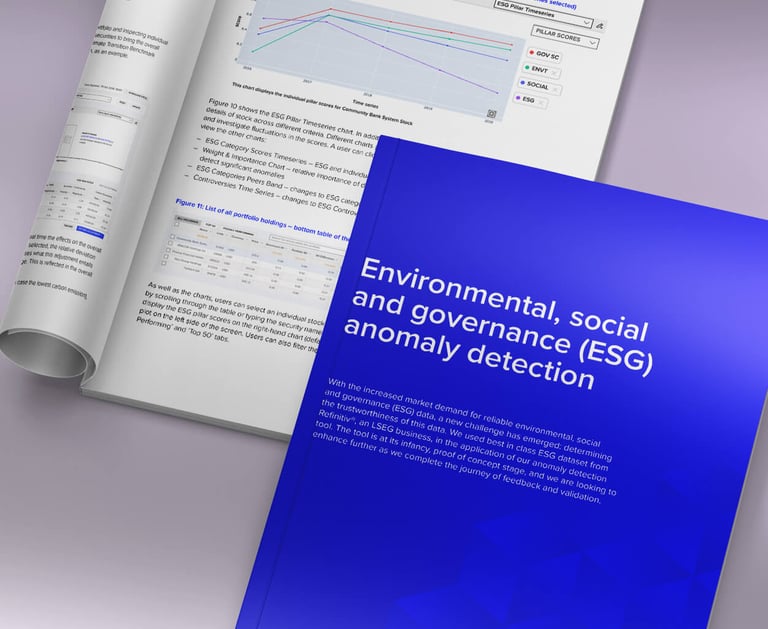
Anomaly Detection In ESG data
Spotting hidden inconsistencies to keep ESG data clean, accurate, and trustworthy
Experimental | White Paper
3/6/20233 min read
What is anomaly detection in ESG data?
ESG anomaly detection identifies unusual changes or patterns in a company’s ESG scores when compared to its own historical performance and to peer companies within the same industry.
Rather than treating all score movements as equal, anomalies are characterised by:
Magnitude — how unusual the change is
Polarity — whether the change reflects a significant improvement or deterioration
This helps users distinguish between normal variation and signals that genuinely require attention — such as potential data errors, structural shifts, or greenwashing risks.

Who is this for?
Designing trust, clarity, and action in complex sustainability data
Regulators
Assess market readiness for ESG regulations
Augment investigation and supervision workflows
Corporates
Improve quality, consistency, and completeness of ESG disclosures
Understand performance relative to industry peers
Strengthen internal target-setting and reporting credibility
Asset Managers
Improve portfolio quality through sharper ESG risk analysis
Identify material risks and opportunities earlier
Generate alpha through more informed portfolio adjustments
Assurance
Identify areas requiring scrutiny
Focus advisory efforts where they add the most value
How it works
The framework combines statistical analysis, machine learning, and explainability techniques to surface actionable ESG intelligence
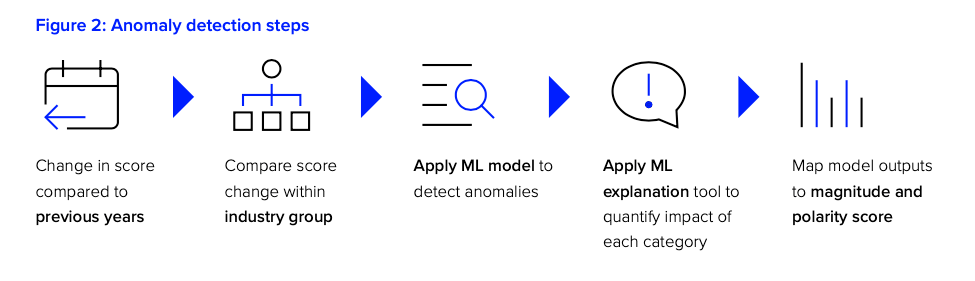

At a high level:
ESG category-level score changes are calculated year-over-year
Changes are normalised and benchmarked within industry peer groups
Statistical techniques (e.g. z-scores) identify unusual deviations
Machine learning models trained on 18+ years of data across ~10,000 companies detect subtle outliers
Model explainability tools quantify which ESG categories contribute most to each anomaly
Results are translated into clear magnitude and polarity signals that are easy to interpret
This allows users to move beyond headline ESG scores and understand what changed, how unusual it is, and why.
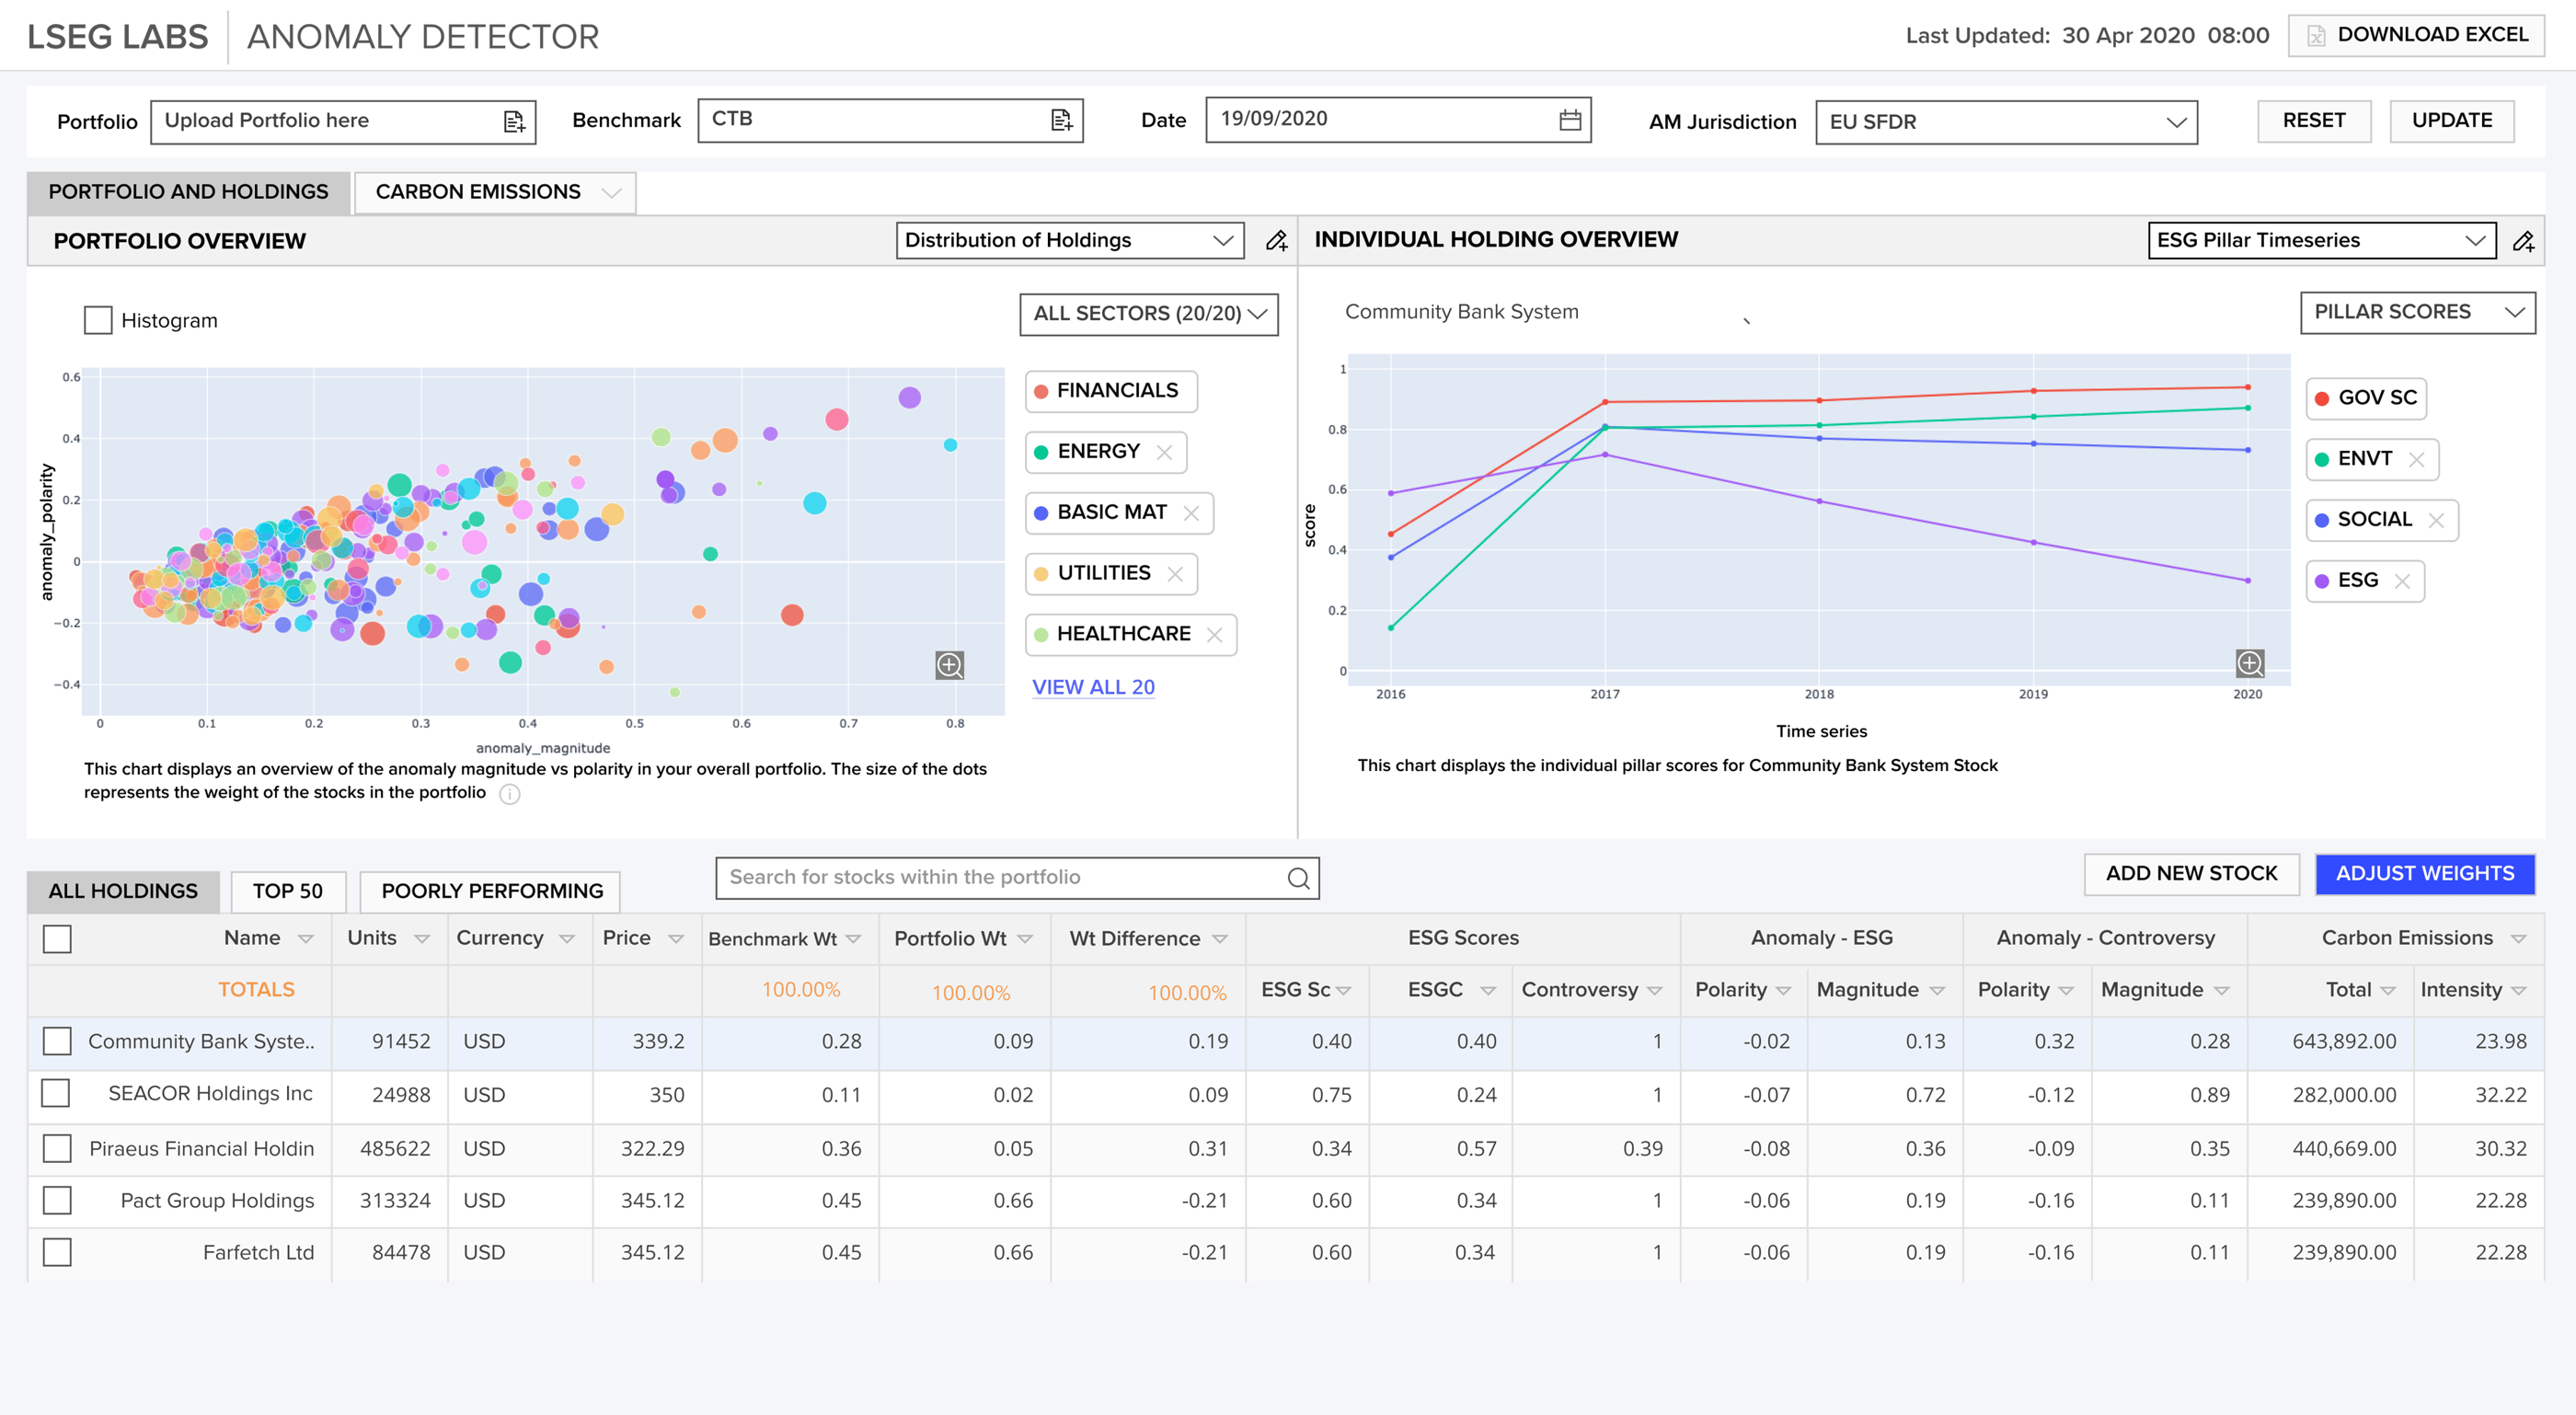
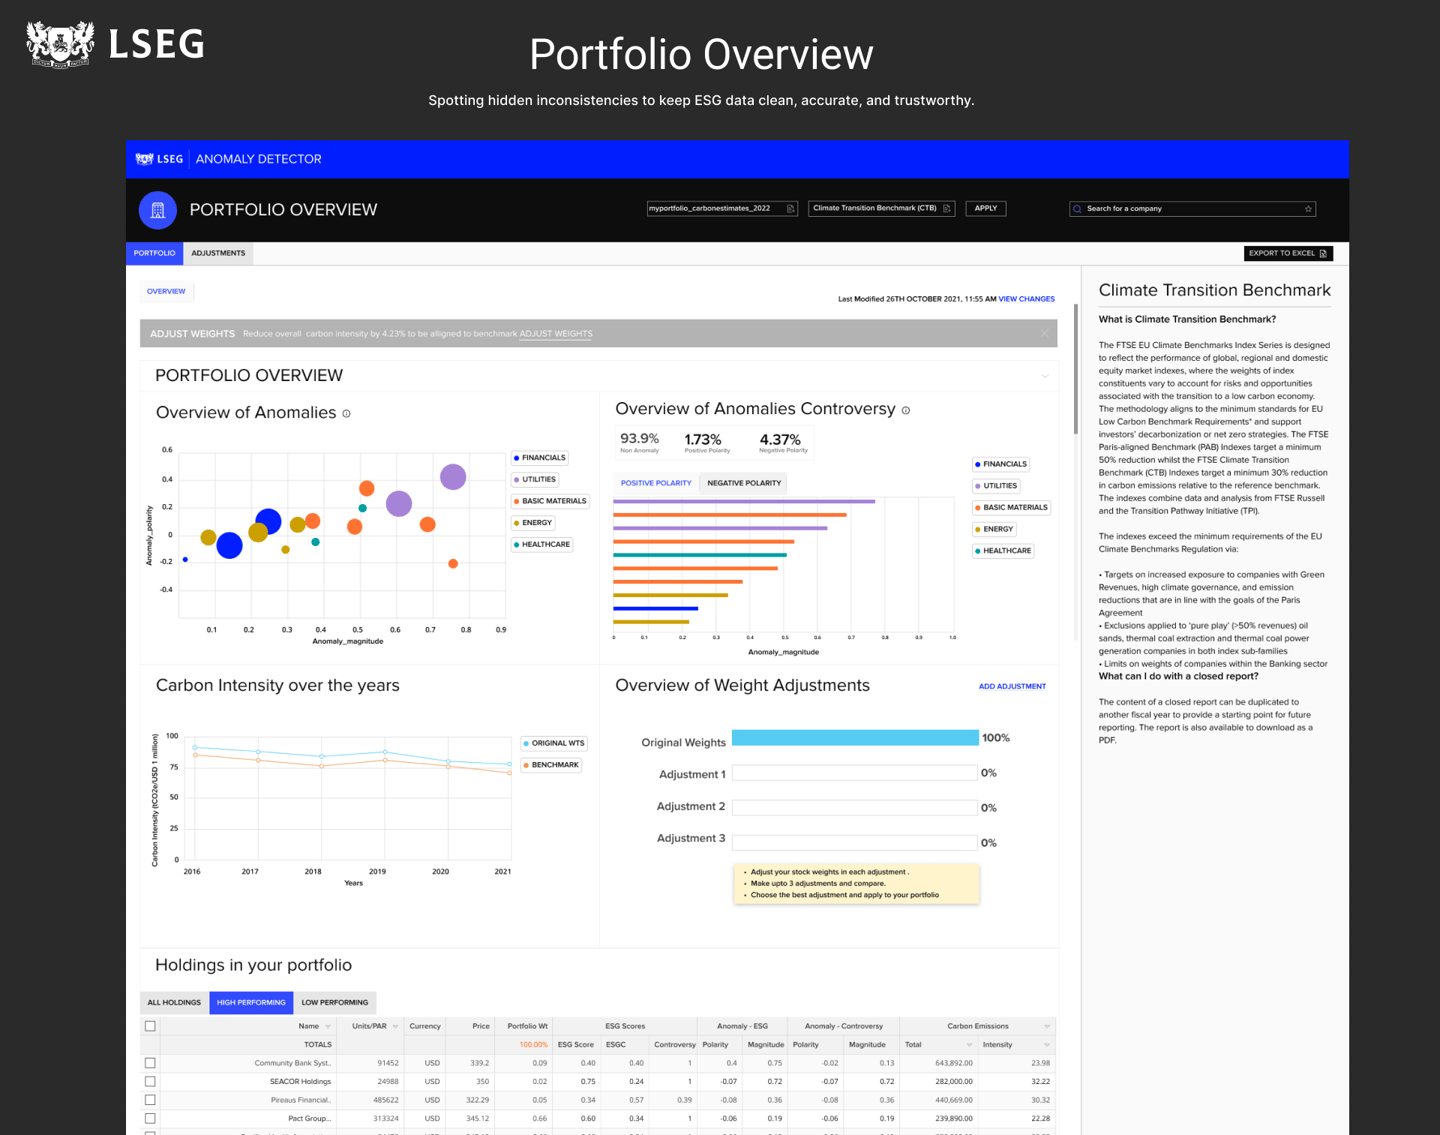
How it’s applied in practice
Each dot represents a company
Position reflects anomaly magnitude and polarity
Dot size represents portfolio weight
Colour indicates industry sector
Most holdings cluster near the centre, indicating low anomaly risk.
Outliers — especially those with large magnitude — immediately stand out and prompt review.
From there, users can:
Drill down into contributing ESG categories
Compare against peer benchmarks
Decide whether to investigate, rebalance, or engage
Anomaly insights are surfaced through intuitive visualisations such as portfolio scatter plots:
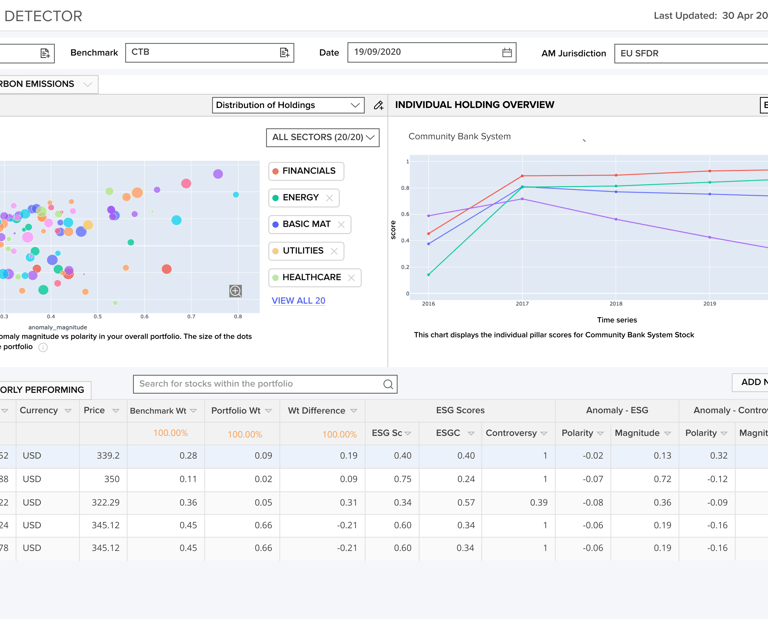
Role
Explainability: Designing clear signals that show why something was flagged and how it compares to peers
Clarity of severity: Visual hierarchy to separate critical anomalies from mild deviations
Traceability: Drill-down paths linking anomalies back to underlying disclosures and categories
Comparability: Peer-benchmark views that make deviations instantly understandable
Workflow integration: Ensuring anomaly review fit naturally into ESG analysis, reporting, and due-diligence flows


Portfolio Use case
" Its Important to see the reason behind the score changes- Including inconsitencies in ESG data"- Portfolio Manager USA

" Competiors are building models to show how risky my portfolio is in terms of Carbon Emissions"

What’s next
The roadmap extends anomaly detection beyond scores alone by:
Linking anomalies to news, events, and emerging trends
Deepening explainability at sub-category and metric levels
Supporting more proactive alerts and scenario analysis
This evolution continues to strengthen confidence in ESG data — helping users not just detect anomalies, but act on them with clarity.